Abstract
This White Paper explains what performance means in a machine-learning system and what key performance indicators (KPIs) are used to evaluate the effectiveness of one machine-learning model over another. Within the context of perception systems for advanced driver assistance systems (ADAS), this White Paper will analyze the various KPIs and how they translate to real-world driving scenarios. This document provides the reader with a greater understanding of KPIs such as recall, precision and specificity and also explains concepts such as true positive, true negative, false negative, false positive and confusion matrix.
Class Labels and the Confusion Matrix
Sensitivity, specificity, precision and recall are a few KPIs used to evaluate the performance of an object detection and classification model in machine learning. Before understanding these KPIs and how they should be interpreted, knowledge of positive and negative class labels and confusion matrices is a prerequisite.
True positive is an outcome where the model correctly predicts a positive output. True negative is an outcome where the model correctly predicts a negative output. The predicted result is the same as the actual output for true positive and true negative instances. The actual output is also known as “ground truth.”
False positive is an outcome where the model predicts a positive output, but a negative output is observed. Conversely, a false negative is an outcome where the model predicts a negative output, but a positive output is observed. To understand these concepts, consider an insurance company that uses machine learning to determine if a driver will get into an accident and uses the below dataset to train its model.
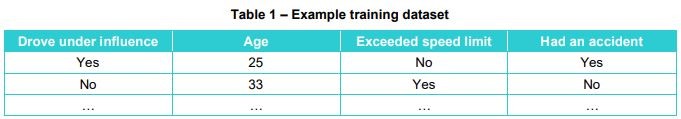
Table 1 – Example training dataset
Once the system is trained, it is deployed for testing against a new dataset unknown to the machine learning model but whose actual results are known. For example, assuming the new dataset against which the model is tested has a list of 100 clients and that the model predicts that 30 clients will experience a mishap and 70 clients will not. The actual results, which are known, showed that out of the 30 that were predicted to be involved in an accident, only ten clients did. Similarly, out of the 70 clients predicted not to have an accident, five experienced an accident while 65 did not, as summarized in the confusion matrix table below:
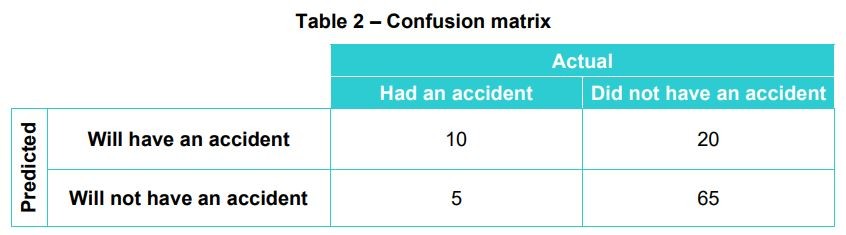
Table 2 – Confusion matrix
As per the confusion matrix above:
• True positive = 10
• True negative = 65
• False positive = 20
• False negative = 5
Sensitivity and Specificity
Sensitivity is also known as “recall” and is explained in more detail in the following section. Specificity measures the proportion of true negative cases that are correctly identified by the model and is calculated as:
Specificity = (True negatives)/(True negatives + False positives)
Using data from the confusion matrix,
Specificity = 65/(65+20) = 0.76
Evaluating specificity is more critical in certain scenarios, such as detecting obstacles on the road. For example, consider a vehicle with engaged adaptive cruise control, automatic lane change and automated emergency braking features while cruising the highway. The vehicle is cruising at high speed when guard rails appear. Some perception systems might falsely detect the guard rails as a different object, potentially causing the vehicle to unnecessarily swerve, deploy emergency braking and/or cause an accident with other vehicles on the road. This hypothetical yet realistic situation results from a false positive (detecting an obstacle when there isn’t one). One of the goals of a perception system is to minimize false positives.
Precision and Recall as KPIs
Precision is the fraction of true positive predictions among all the positive predictions made by the model. In other words, precision measures the model’s accuracy in predicting the positive class label. A high precision score indicates that the model performs well predicting the positive class and makes few false positive predictions. High precision is critical for safer advanced driver assistance systems and to boost consumer trust. False positives by a perception system imply the presence of an object on the road that does not exist and have potentially life-threatening consequences. Such events cause significant stress to the driver and passengers in the vehicle and erode trust in ADAS. Mathematically,
Precision = (True positives)/(True positives + False positives)
Using data from the confusion matrix,
Precision = 10/(10+20) = 0.33
Recall, also known as “sensitivity,” is the fraction of true positive predictions among all actual positive cases. A high recall score indicates that the model correctly identifies all the positive instances with few false negative predictions. Within perception and ADAS systems, a high recall score is critical. A low recall score implies high false negatives, which translates to the perception system being unable to detect an object that exists in reality. In real-world driving conditions, a false negative could mean not detecting a car, a pedestrian or any other object, which could result in an accident. Mathematically,
Recall = (True positives)/(Tue positives + False negatives)
Using data from the confusion matrix,
Recall = 10/(10+5) = 0.67
Both precision and recall are essential measures of the performance of a classification model and are often used together to evaluate the overall effectiveness of the model. However, there is a trade-off between precision and recall, as increasing one often leads to a decrease in the other.
For example, suppose we set a very high threshold for a model to classify a sample as positive. In that case, we may achieve high precision but low recall because the model only makes positive predictions when it is very confident and may miss others. Conversely, suppose we set a very low threshold for the model to classify a sample as positive. In that case, we may achieve high recall but low precision because the model makes positive predictions even when it is not very confident, and many of these predictions may be incorrect. These incorrect predictions pose a serious challenge to perception system developers. Should the perception system be biased to reduce false positives and avoid incidents due to phantom objects, or should the system be biased to reduce the proportion of false negatives and potentially drive into an object? A high-performing perception system should reduce both false negatives and false positives.
Evaluating Real-World Sensor Fusion and Perception Solutions
Sensor fusion is the merging of data from at least two sensors. Perception refers to the processing and interpretation of sensor data to detect, identify, track and classify objects. Sensor fusion and perception enable an automated driver assistance system to develop a 3D model of the surrounding environment that feeds into the vehicle control unit.
Many sensor fusion solutions perform object-level fusion wherein each sensor (e.g., camera, radar, LiDAR), with its inherent limitations, identifies and classifies objects individually. The object-level fusion technique runs machine learning-based perception algorithms on individual sensor data. However, this results in poor performance and is not optimal because no single sensor can detect all objects under all conditions, as highlighted by their strengths and weaknesses in the table below. Furthermore, when sensor data is not fused, the system may get contradicting inputs from sensors and is unable to determine with a degree of certainty the next action.
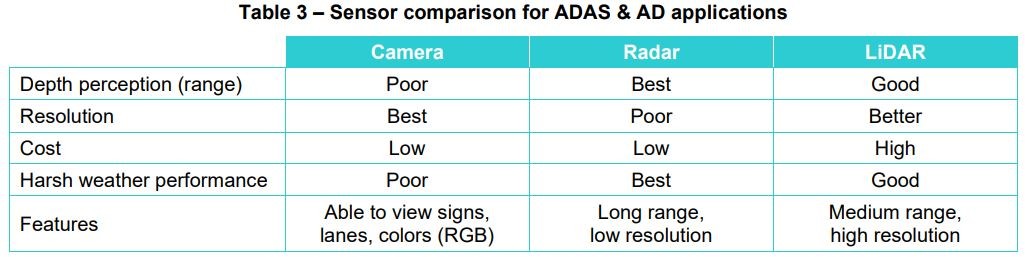 Table 3 – Sensor comparison for ADAS & AD applications
State-of-art solutions that deliver a 3D environmental model for the vehicle’s ADAS system leverage lowlevel fusion wherein raw data from all the sensors on board a car is fused (thereby compensating for other sensors’ weaknesses), and then machine learning algorithms for perception are run on this combined dataset.
LeddarVision™ is a low-level sensor fusion and perception platform that generates a comprehensive 3D environmental model with multi-sensor support for camera, radar and LiDAR configurations for advanced driver assistance systems. The key features of LeddarVision are high performance, cost-effectiveness, scalability and sensor agnosticism. However, for this White Paper, the focus will be on evaluating performance using the metrics discussed in the preceding sections.
Ideally, a machine learning model should have precision and recall scores of one, meaning zero false positives or negatives, and this remains the goal, i.e., to build models that deliver performance as close to one. While traditional techniques such as object-level fusion tune between precision and recall and are confined to delivering performance within the black dotted line, low-level fusion does not just tune between precision and recall but pushes the performance envelope to deliver a better mean average precision (mAP). Mean average precision is a metric used to evaluate object detection models such as Fast R-CNN, YOLO* , Mask R-CNN and others. Its raw data fusion technology detects very small obstacles on the road with better detection rates and fewer false alarms than legacy “object fusion” solutions.
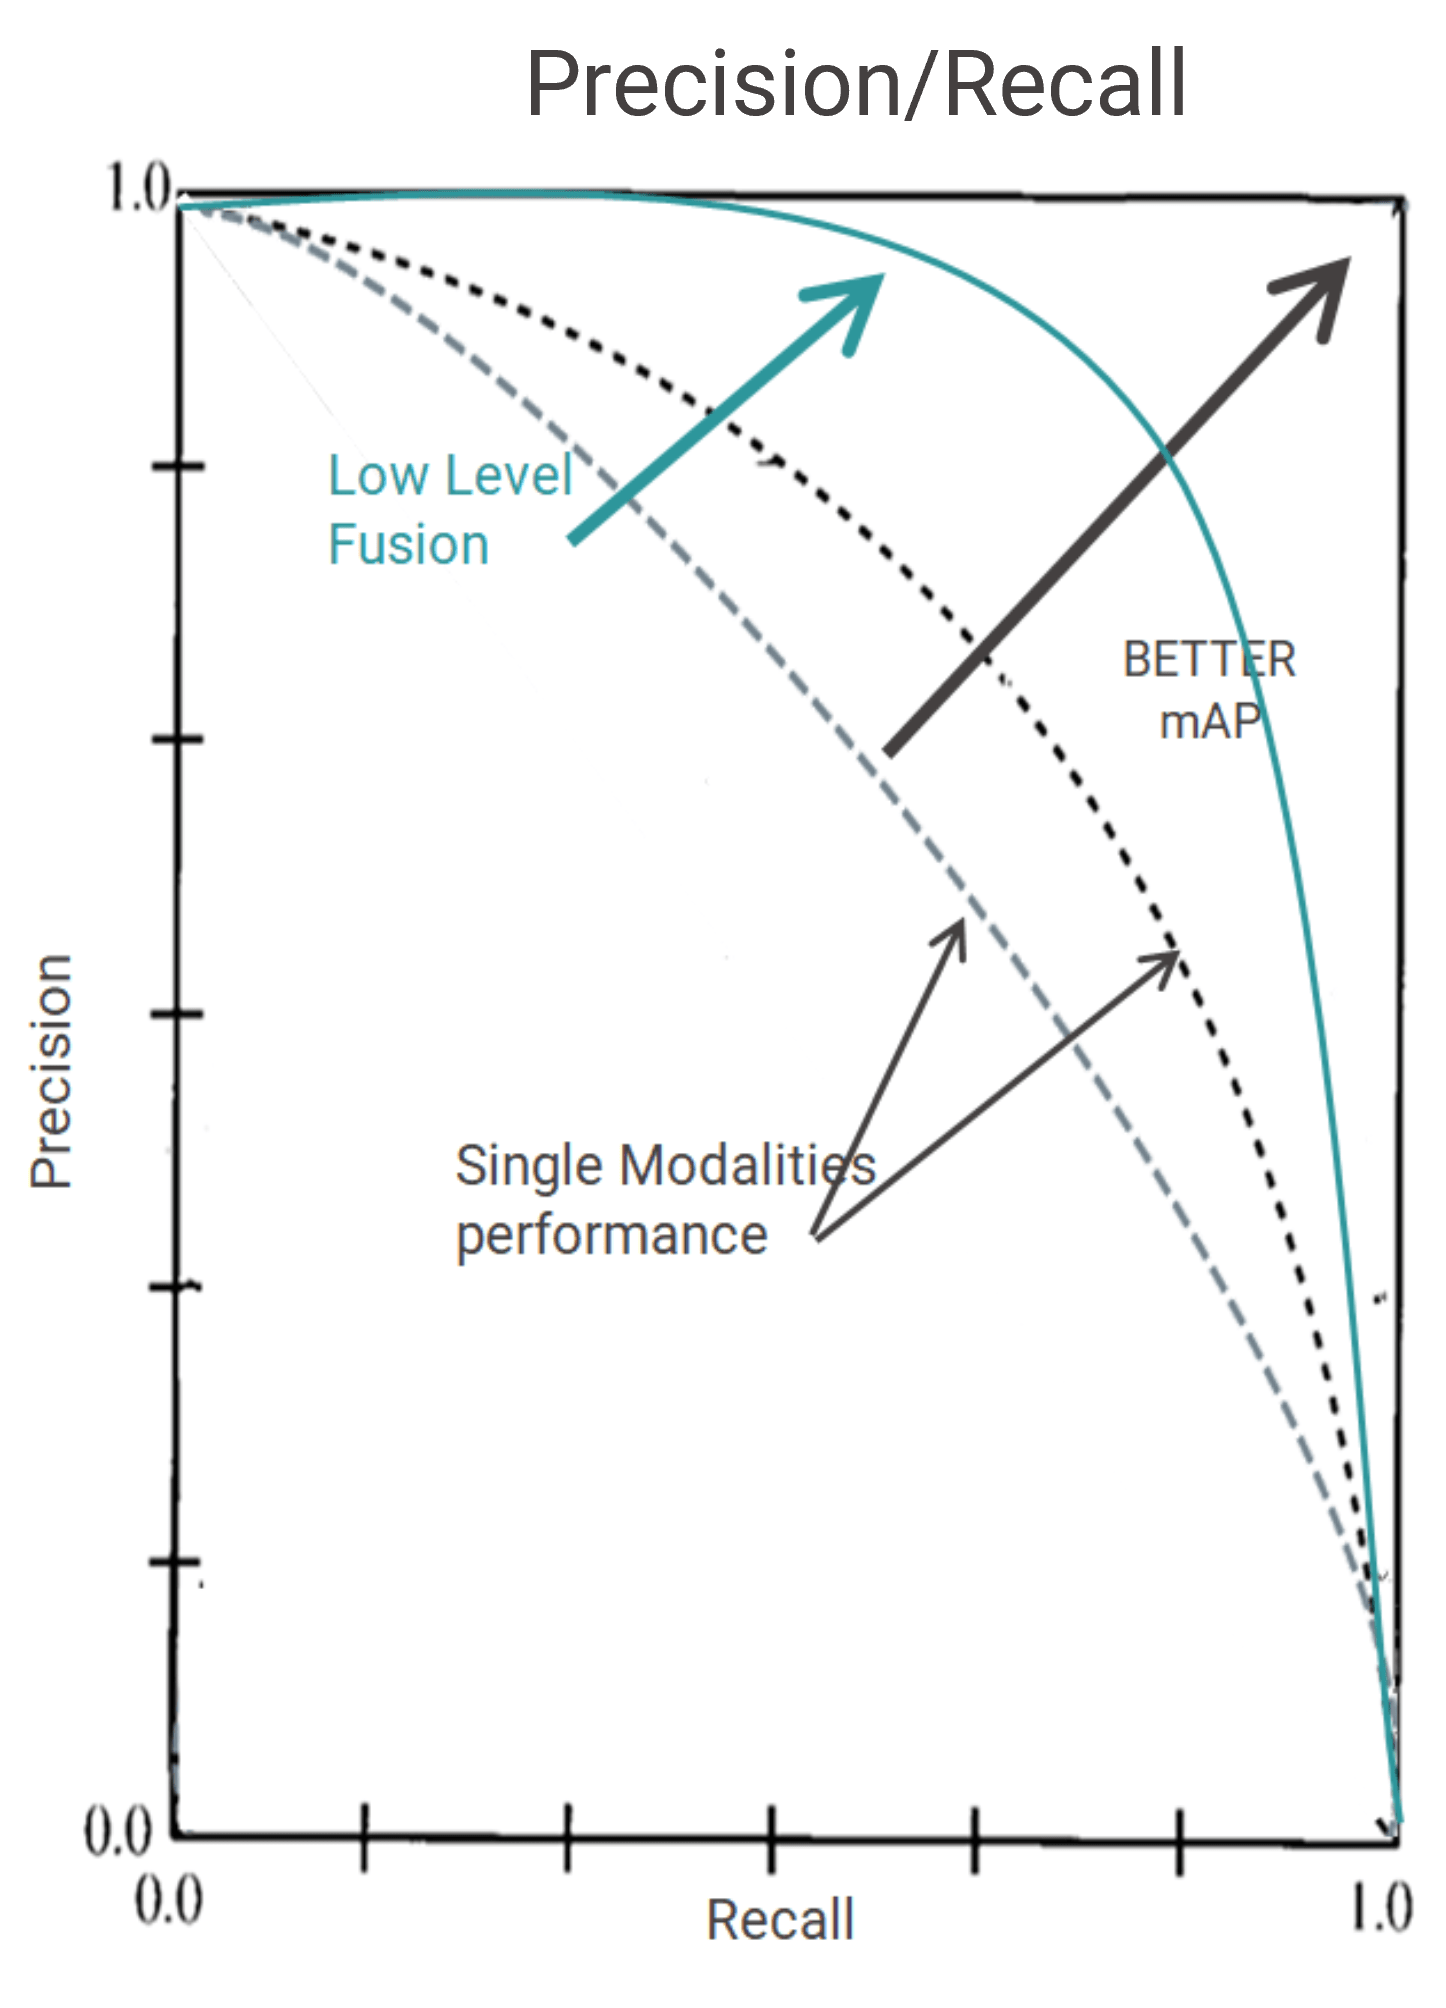 Figure 1- AI-based LeddarVision pushes the performance envelope resulting in higher precision and recall
Summary
False alarms are a critical component of sensor fusion and perception systems and have significant consequences for the performance of ADAS systems, ranging from a collision that leads to fatalities to annoyingly wrongful activation of warning systems. However, even the seemingly benign wrongful activation of a warning system can have serious consequences.
One way of evaluating machine learning models is through key performance indicators such as specificity, precision and recall (i.e., sensitivity), assigning a mathematical number to the model’s performance. While legacy object-level fusion can only tune between precision and recall, low-level fusion pushes the performance envelope to deliver a superior mean average precision score, a metric used to evaluate performance. Refer to the following resources to learn more about low-level fusion, LeddarTech’s technology and product offerings and technical and industry resources.
Performance Videos LeddarVision
Products for ADAS Perception FAQs
*You Only Look Once
This White Paper does not constitute a reference design. The recommendations contained herein are provided “as is” and do not constitute a guarantee of completeness or correctness. LeddarTech® has made every effort to ensure that the information contained in this document is accurate. Any information herein is provided “as is.” LeddarTech shall not be liable for any errors or omissions herein or for any damages arising out of or related to the information provided in this document. LeddarTech reserves the right to modify design, characteristics and products at any time, without notice, at its sole discretion. LeddarTech does not control the installation and use of its products and shall have no liability if a product is used for an application for which it is not suited. You are solely responsible for (1) selecting the appropriate products for your application, (2) validating, designing and testing your application and (3) ensuring that your application meets applicable safety and security standards. Furthermore, LeddarTech products are provided only subject to LeddarTech’s Sales Terms and Conditions or other applicable terms agreed to in writing. By purchasing a LeddarTech product, you also accept to carefully read and to be bound by the information contained in the User Guide accompanying the product purchased.